In June 2011 I made a map of Boston-area apartment prices. I've made an updated version: $/room, $/bedroom. As before the data comes from the (awesome) site padmapper, which means it's pretty close to all Boston-area apartments currently on the market.
| 6/2011 | 1/2013 | |
|---|---|---|
| per room | 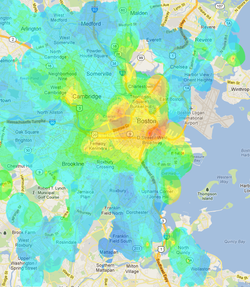 | 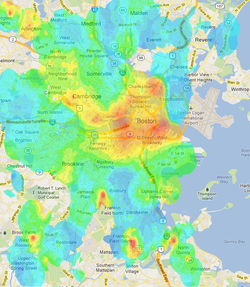 |
| per bedroom | 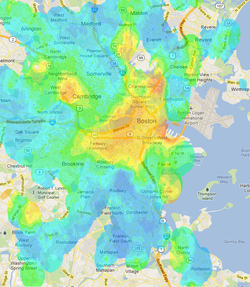 | 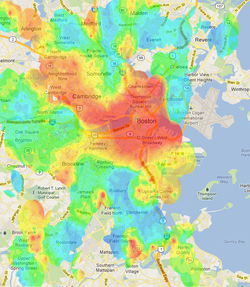 |
This is a different time of year (note to self: repeat in June) so I don't know how much of the change is seasonal. Last time I had 4471 listings with an average of $767/room and $1141/bedroom, now I have 3405 listings with an average of $895/room and $1314/bedroom. This is a much greater increase than inflation: the CPI in June 2011 was 225.922 while the December 2012 one was 229.594, so you would expect $767/room then to turn into $780/room now instead of the $895 we actually see.
(The code is on github.)
Update 2013-01-31: Someone was wondering if combining different sized apartments into one map might be misleading. So I made a version that's just two-bedroom apartments. (That's the most common size, at 986 listings.)
Update 2013-02-01: Someone adapted my code and made maps for Toronto, San Francisco, Chicago, and Detroit.
Update 2013-02-02: I regenerated the maps after manually cleaning up some bad data.
Update 2013-02-09: I made ones for Atlanta and Baltimore. Someone else made one for Washington DC.
Comment via: google plus, facebook, r/boston


